Virtual Lab Tension Test
Plastic Behavior in uniaxial tension and compression:
Close the window to return to the tension test
In chapter we had discussed the linear relationship between stress and strain in an isotropic material. This linear relationship forms the basis of theory of elasticity, which is widely used to determine stress or strain in structural elements under a specific loading condition. These stresses are generally restricted to be less than the yield strength of the material. Thus the design is considered safe, and it is hoped that additional secondary stresses such as residual stress due to fabrication and assembly, stress concentrations, etc will not combine to produce failure by yielding.
Study of the plastic behavior of structural elements is concerned with the analysis of stress and strains in the plastic as well as elastic ranges. It provides a more realistic estimate of the load carrying capacities of structures and provides a more complete understanding of the response of structural elements to the forces induced in the material. And this information is essential to the engineer for designing optimum and reliable structures.
In this chapter we will only consider the simplest type of loading, which is represented by a uniaxial stress state. Such a stress state occurs in a simple tension or compression test. In these tests there is only one non-zero principal stress. In a tension test ![]() . In a compression test,
. In a compression test, ![]() .
.
Modeling Plastic Behavior Under Uniaxial and Monotonic loading:
Several idealized models are used to study deformation in plastic region. These models are briefly described here
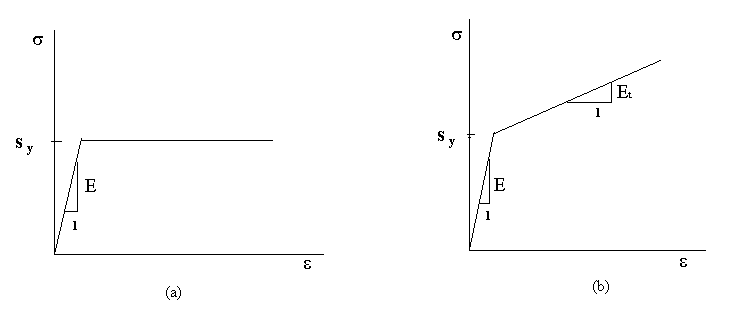
1.Elastic-perfectly plastic model: This model assumes that plastic flow occurs as the stress reaches the yield stress S y. It neglects the effect of work hardening. The uniaxial tension stress-strain relations can be expressed as
![]() for
for ![]()
![]() for
for ![]()
Where ![]() is the elastic modules, and
is the elastic modules, and ![]() is a scalar parameter greater than zero and to be determined.
is a scalar parameter greater than zero and to be determined.
The deformation response is schematically shown in figure (a)

2. Elastic-Linear Work Hardening Model: In this model the elastic and plastic regions are approximated by two straight lines, as shown in figure (b). The first line with a slope of E represents the elastic region. The second straight line represents in an idealized fashion the work hardening region, and has a slope Et < E. The uniaxial tension stress-strain relations can be expressed as
![]() for
for ![]() <= Sy
<= Sy
![]() for
for ![]() > Sy
> Sy
Thus the above two models idealize an actual ![]() -
- ![]() curve with straight lines.
curve with straight lines.
3. Elastic-Experimental Hardening model: This model fits the experimentally obtained ![]() -
- ![]() curve more closely by modeling the work hardening region with an exponential curve. The stress-strain relations are expressed as
curve more closely by modeling the work hardening region with an exponential curve. The stress-strain relations are expressed as
![]() =
= ![]()
![]() > for
> for ![]() <= Sy
<= Sy
![]() =
=![]() n for
n for ![]() > Sy
> Sy
where k and n are two constants, which are characteristics of a particular material, and are determined to best fit the experimentally obtained curve. The deformation is schematically shown in figure (c). In the second equation ![]() represents the total strain, and hence must pass through the point representing the yield stress S yand the corresponding elastic strain.
represents the total strain, and hence must pass through the point representing the yield stress S yand the corresponding elastic strain.
Idealized stress-strain curves

4. Ramberg-Osgood Model: The non-linear ![]() -
- ![]() curve, as shown in figure (d) has the following representation
curve, as shown in figure (d) has the following representation
![]()
![]()
where a, b, and n are material constants. The initial slope of the curve takes on the value of the elastic modulus E at ![]() = 0. This model uses three fitting parameters and can be used to obtain a better fit of the experimental
= 0. This model uses three fitting parameters and can be used to obtain a better fit of the experimental ![]() -
- ![]() curves.
curves.
Mechanics - Materials Linkage During Plastic Flow:
Here plastic flow refers to the irreversible deformation occurring during uniaxial loading of a material. Irreversible, or inelastic, or plastic deformation consists primarily of three regions, namely, yield point, strain hardening, and fracture. The mechanics - materials link for each of these regions is described below.
YIELDING:
Yielding in a material pertains to the first sign of deviation from elastic deformation, which is fully recoverable, to an irrecoverable deformation. Yielding also refers to the first sign of plastic flow. Further straining of the material may or may not result in more plastic flow. Brittle materials such as ceramics may break with minimal yielding, while metals such as steel and aluminum may under go large plastic deformation before fracturing.
Plastic deformation behavior in engineering metals is related to slip processes occurring within an individual crystal. A typical structural metal is composed of an aggregate of single crystals within grains, and is known as a polycrystalline material. Thus we will first develop concepts for slip in a single crystal and then apply the results to polycrystalline materials.
Yielding in Single Crystals:
Yielding or initiation of plastic flow in single crystals is described in terms of a critical stress parameter, the critical resolved shear stress (CRSS). CRSS depends on the crystal structure, orientation of the active slip plane with respect to the direction of the external load, size of the crystal, temperature, and strain rate.

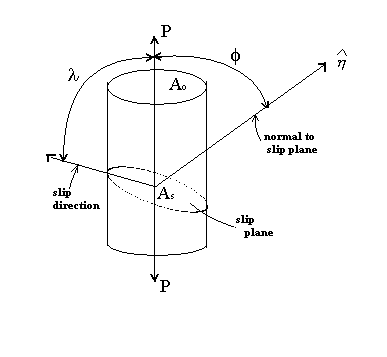
If a single crystal of a certain material is subjected to an axial stress (tensile or compressive), plastic flow can occur by slip on one or more of the possible slip systems. Which slip system will become active can be determined by a simple consideration of the figure below. Consider a
cylindrical single crystal, as shown, of cross-sectional area Ao. Let us assume that this crystal has only one potential slip system. If P is the applied load the resolved force parallel to the slip plane is PCos![]() . The area of the slip plane, As is Ao/Cos
. The area of the slip plane, As is Ao/Cos![]() . Thus the resolved shear stress
. Thus the resolved shear stress ![]() acting on the slip plane and in the slip direction is given by
acting on the slip plane and in the slip direction is given by
![]() =
= ![]()
![]() =
=![]()

where ![]() is the applied axial tensile stress.
is the applied axial tensile stress.
In a typical engineering material there can be several slip systems each oriented differently with respect to the tensile stress axis. A single applied stress ![]() will produce different values of
will produce different values of ![]() on each slip system, and one of these will experience the greatest
on each slip system, and one of these will experience the greatest ![]() . When
. When ![]() reaches a critical value, which depends on the material, plastic flow will initiate in that slip system. Thus the critical resolved shear
reaches a critical value, which depends on the material, plastic flow will initiate in that slip system. Thus the critical resolved shear ![]() is related to the tensile yield stress through the equation
is related to the tensile yield stress through the equation

The value of ![]() is generally invariant for a given material. Some exceptions are found for BCC type materials. The value of
is generally invariant for a given material. Some exceptions are found for BCC type materials. The value of ![]() also depends on test conditions, such as temperature, strain rate, and structural features such as initial dislocation density and purity. Decrease in temperature and purity and increase in strain rate and dislocation density increases
also depends on test conditions, such as temperature, strain rate, and structural features such as initial dislocation density and purity. Decrease in temperature and purity and increase in strain rate and dislocation density increases ![]() .
.
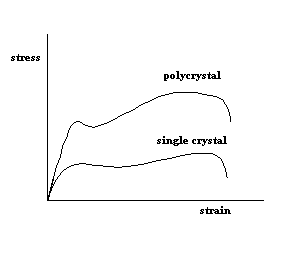
The slip mechanisms occurring in a single crystal also hold for polycrystals. However, the deformation response varies considerably between these two types of materials, as shown below in a schematic sketch.

The main reason for this difference is due constraints at the grain boundaries and differing orientations of individual crystals in the polycrystalline material. Each grain in a polycrystal has three tensile and three shear strain components (assuming a two dimensional model). However, only five of these are independent because the dilatational strains are related through the constant-volume condition,![]() , of plastic deformation. Thus it can be shown that fine slip systems are necessary to have compatibility of displacements across grain boundaries. However, experimental studies have shown that five or more slip systems operate near the grain boundaries but only two or three slip systems operate towards the center of the grains. This leads to a higher dislocation density near the grain boundaries compared to the center of the grains. This results in greater hardness near the grain boundaries, and hence a greater resistance to deformation, resulting in a higher flow stress in polycrystal materials. The differing orientations of single crystals in a polycrystal also contribute to a higher flow stress. As the stress increases in a tensile test different crystals deform at different stages depending on their orientation. The crystal with the highest value of
, of plastic deformation. Thus it can be shown that fine slip systems are necessary to have compatibility of displacements across grain boundaries. However, experimental studies have shown that five or more slip systems operate near the grain boundaries but only two or three slip systems operate towards the center of the grains. This leads to a higher dislocation density near the grain boundaries compared to the center of the grains. This results in greater hardness near the grain boundaries, and hence a greater resistance to deformation, resulting in a higher flow stress in polycrystal materials. The differing orientations of single crystals in a polycrystal also contribute to a higher flow stress. As the stress increases in a tensile test different crystals deform at different stages depending on their orientation. The crystal with the highest value of ![]() will deform last. Other factors such as grain size can also significantly affect yielding.
will deform last. Other factors such as grain size can also significantly affect yielding.
Special behavior at yield: Some materials such as low carbon steels and heat treated aluminum-magnesium solid solution alloys display an upper and a lower yield point in a tensile stress-strain curve. This is due to the presence of solute atoms in a solid solution either as interstitial atoms or substitutional atoms. The interstitial atoms anchor the dislocations while the substitutional atoms retard the motion of dislocations. The anchoring of dislocations results in the sharp display of yield in a tensile test. Pure iron does not display a sharp yield point, as it does not have interstitial carbon atoms, as does steel. In the absence of interstitial the material would yield at a stress of ![]() . The presence of interstitial anchors the dislocation forming small clusters around them,
. The presence of interstitial anchors the dislocation forming small clusters around them,

which retard the slip process and hence raise the yield point to ![]() . When the stress level raises further the dislocations begin at slip, and move away from the cluster, allowing slip to occur at the lower stress level
. When the stress level raises further the dislocations begin at slip, and move away from the cluster, allowing slip to occur at the lower stress level ![]() .
.
True stress-True strain curve:
The engineering stress-strain curve is based on the original dimensions of the specimen, namely the area of cross-section and the gage length. In an actual test both these quantities change. Hence an engineering ![]() -
- ![]() curve is not an accurate representation of the materials response in tension. Though this characterization of materials is sufficient for design purposes, as it underestimates the load carrying capacity, it is not accurate for optimum design and for determining the plastic flow characteristics.
curve is not an accurate representation of the materials response in tension. Though this characterization of materials is sufficient for design purposes, as it underestimates the load carrying capacity, it is not accurate for optimum design and for determining the plastic flow characteristics.
True stress and true strain are defined as
![]() ----------------------(1)
----------------------(1)
![]() ----------------------(2)
----------------------(2)
and ![]() -----------------------(3)
-----------------------(3)
and note that ![]() +
+ ![]() ------------------------(4)
------------------------(4)
Also since mass is conserved and density change is negligible during plastic flow, the total volume of the material is constant. Hence
![]() = Constant -------------------------(5)
= Constant -------------------------(5)
Using the above equation's relations between true ![]() ,
, ![]() and engineering
and engineering ![]() ,
, ![]() can be developed.
can be developed.
Using equations (3) and (4)
![]() ----------(6)
----------(6)
Rewriting equation (1) and using equation (5)
![]() ------(7)
------(7)
Equation (6) and (7) are true only upto the maximum load or the ultimate tensile load in an engineering stress -strain curve. After this load actual measurements are needed.
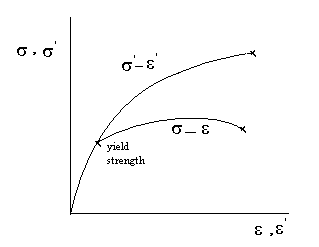
A schematic representation of the engineering and true stress-strain curves is shown below.

The true ![]() -
-![]() curve deviates from the engineering curve after elastic deformation, or from the yield point. The true
curve deviates from the engineering curve after elastic deformation, or from the yield point. The true ![]() -
-![]() curve increases monotonically up to fracture.
curve increases monotonically up to fracture.