Virtual Lab Fatigue Test
Constitution
Close the window to return to the fatigue test
Since we are considering here only the elastic deformation, high-cycle fatigue process, our Hookean material model will still serve us. In the particular case of pure shear, our constitutive model looks like:
![]()
Various macroscopic models of the fatigue process exist, including the stress-life, strain-life, and fracture mechanics approaches. We will concentrate here only on the stress-life approach, as it has been shown to fit reasonably well to high-cycle fatigue.
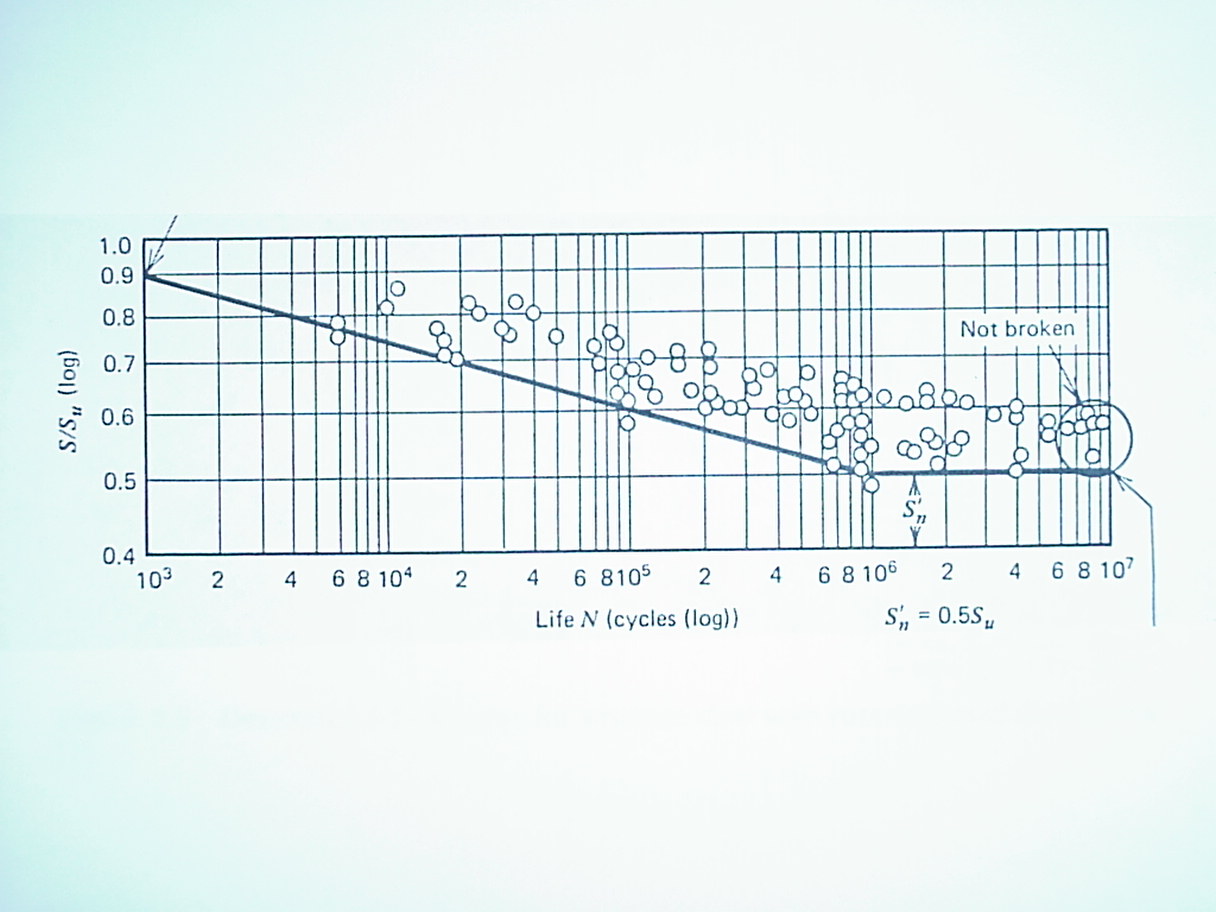
The stress-life approach seeks to determine a fatigue strength (SN) and/or an endurance limit (Se¢ ¢) as a function of the number of cycles of loading (from a "S – N" plot). The fatigue strength is the failure stress at some number of cycles N. The endurance limit is the stress below which the structural member will have "infinite" life (e.g., > 106 cycles). An example S-N curve is given in Figure 7.3.1.
Not all materials show a well-defined endurance limit – aluminum and other non-ferrous metals are examples. The "prime" symbol, e.g., in Se¢ , is used to indicate results from laboratory tests on ideal specimens.

Figure 7.3.1. S-N curve for wrought steel. Note that the strength values are normalized by the ultimate tensile strength.
To get a feel for fatigue strength values, the endurance limit of steel and cast iron can be approximated by (say, for preliminary design purposes):
|
Material |
S |
Ultimate tensile strength SU,T |
|
Steel |
0.5 SU,T |
< 200 kpsi (1400 MPa) |
|
100 kpsi (700 MPa) |
> 200 kpsi (1400 MPa) |
|
|
Cast Iron |
0.35 SU,T |
< 88 kpsi (600 MPa) |
|
40 kpsi (275 MPa) |
> 88 kpsi (600 MPa) |
Table 7.3.1. Approximate endurance limit of steel and cast iron relative to ultimate tensile strength.